
Pricing mutual funds sounds dry, but in 2025 it’s where regulation, algorithms and investor behavior all collide. If you’ve ever wondered why your fund’s price only updates once a day, why the “official” NAV can differ from what you think the portfolio is worth, or what those tiny expense ratios really do to long‑term returns, you’re in the right place. Below we’ll keep the tone human, but still use the right technical terms so *mutual fund pricing explained* doesn’t stay a black box forever.
—
How Mutual Fund Pricing Works Today
At the core of mutual fund pricing sits Net Asset Value, or NAV. In simple terms, NAV is the total value of all portfolio assets minus liabilities, divided by the number of shares outstanding. That’s the short version of *how are mutual fund share prices calculated*, but real‑world implementation is messier. You have end‑of‑day market closes across multiple time zones, illiquid bonds, derivatives, and corporate actions hitting the book at different times. Pricing services stream in quotes, fair‑value adjustments are applied for thinly traded securities, and the fund’s accounting system strikes a single NAV after the market close, which then becomes the price for all orders submitted before the cutoff.
—
NAV Basics vs. Market Reality
A common confusion is *mutual fund NAV vs market price difference*. Classic open‑end mutual funds don’t trade intraday, so you never see a bid/ask spread on screen like with ETFs; you just get the final NAV. However, the fund’s underlying holdings do trade all day, and during periods of volatility, the “economic” value of the portfolio can diverge from the last available quotes that go into the NAV. To close this gap, many managers rely on fair‑value pricing models to adjust stale quotes, especially for emerging‑market equities and high‑yield bonds. In 2025, regulators increasingly expect funds to document these models and stress‑test them, because mis‑priced NAVs can lead to hidden wealth transfers between incoming and outgoing investors.
—
Beyond Plain Vanilla: Swing Pricing and Dual Pricing
Post‑COVID volatility pushed more funds toward swing pricing—adjusting NAV when net flows exceed a preset threshold. Instead of letting existing shareholders eat the transaction costs of large subscriptions or redemptions, the NAV “swings” up or down by a few basis points to pass those implicit costs to traders causing the flow. Some jurisdictions use a single‑priced model with swing factors; others still allow dual pricing with separate bid and offer prices. From an investor’s point of view, this can be confusing, but the intent is simple: protect long‑term holders. As a result, *mutual fund pricing explained* in 2025 almost always includes some mention of liquidity management tools, not just traditional NAV math.
—
Technology Behind Pricing: 2025 Edition
Mutual fund pricing is now heavily automated. Cloud‑native fund accounting platforms ingest tick data, corporate‑action feeds, FX rates and evaluated prices from multiple vendors. Machine‑learning models flag outliers—for instance, a bond price that deviates too far from model value or from peers. In fixed income and structured credit, where you rarely have clean last‑trade data, these evaluated prices are essential. The downside is model dependency: if the vendor’s curve is off, everyone relying on it is also off. The industry is quietly moving toward explainable AI in pricing engines, so risk teams can trace why a certain bond fed into NAV at 93.2 instead of 95.7, and whether that difference is material to the shareholder.
—
Pros and Cons of Modern Pricing Tech

Automation made NAV strikes faster and more consistent, but not magically perfect. Key pros include:
– Scalability: One pricing engine can support hundreds of funds across asset classes and currencies.
– Error reduction: Fewer manual overrides, with systematic checks for stale quotes or missing securities.
– Regulatory audit trails: Every price, override and tolerance breach is logged for review.
Trade‑offs are real, though:
– Vendor concentration risk when many funds rely on the same data sources.
– Model opacity, especially in complex fixed‑income evaluations.
– Operational complexity in reconciling differences between multiple pricing feeds and internal models.
Investors should not just trust the buzzwords—understanding how your fund’s NAV is actually produced is part of risk due diligence.
—
Comparing Different Pricing Approaches
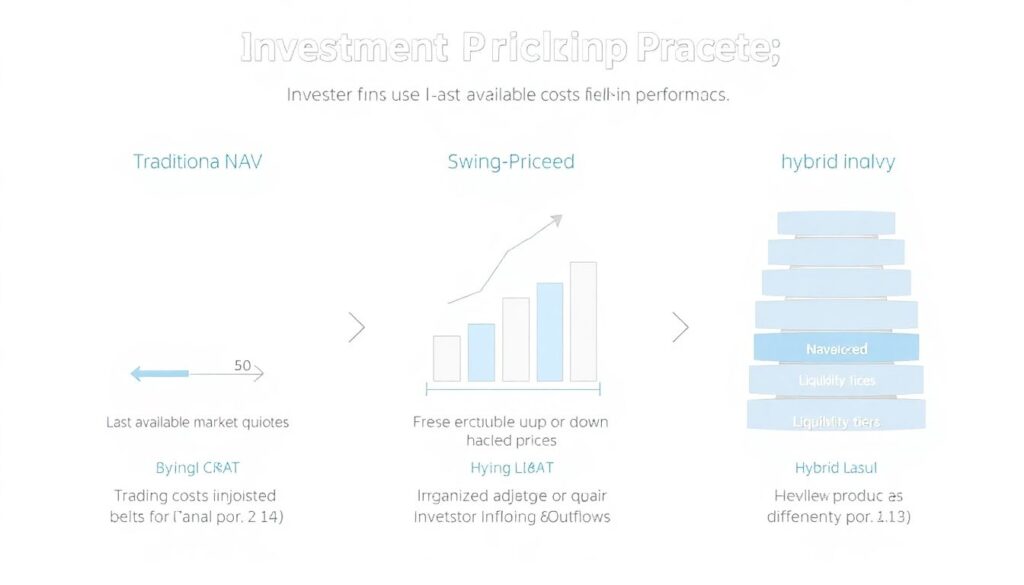
From an investor’s seat, there are three broad approaches you’re likely to encounter. Traditional daily NAV funds use last available quotes and simple allocation of trading costs into overall performance. Swing‑priced funds explicitly adjust NAV for flows, and some hybrid products use liquidity tiers to treat highly illiquid assets differently at pricing time. Technically, each approach is trying to solve the same problem: who bears the cost of liquidity when money moves in or out? In 2025, income and bond funds are more likely to use swing pricing, while large equity index funds tend to stick with classic daily NAV due to their lower trading frictions and better overlap with liquid benchmarks.
—
When NAV Diverges from Intuition
You may notice your bond fund hardly moves on some busy trading days, then jumps unexpectedly later. That’s usually about data timing, not magic alpha. Pricing services may only update certain securities once a day, while new information is being priced into similar instruments in real time. Funds with higher exposure to private credit or securitized products see this effect more strongly. Hence, the *mutual fund NAV vs market price difference* sometimes reflects a slow translation of market reality into official valuations. If you’re comparing funds, pay attention to disclosure about valuation policies and how often different asset types are repriced; in stress events, this can materially affect both performance charts and entry/exit fairness.
—
Costs, Fees and What You Really Pay
Understanding *how to evaluate mutual fund costs and fees* is inseparable from understanding pricing. Expense ratios, trading costs, swing factors, performance fees and even securities‑lending revenue all interact with NAV. In 2025, platforms increasingly surface a “total cost of ownership” metric that estimates the drag of both explicit and implicit costs. For plain index equity funds, the headline expense ratio may be a good proxy, but for active bond or multi‑asset strategies, internal trading and liquidity costs can dominate. A low fee on paper doesn’t help if the portfolio churns illiquid assets in a narrow market. Regulators push for standardized cost breakdowns, yet methodologies differ, so you still need to read the notes, not just the marketing factsheet.
—
How to Pick Cost‑Effective Funds in 2025
If you’re searching for the *best low fee mutual funds to invest in*, start with cost screens but don’t stop there. At a minimum, scrutinize:
– Expense ratio and fee structure: Fixed vs performance‑linked, breakpoints for larger share classes.
– Trading intensity: Turnover metrics and asset‑class liquidity profile.
– Share‑class design: Load vs no‑load, clean share classes on platforms, and any wrap fees.
Next, overlay performance consistency and downside behavior. Two cheap funds tracking similar benchmarks can diverge sharply during stressed markets if one uses more aggressive sampling or securities lending. Long‑term investors should simulate fee drag over a 10–15 year horizon: even a 0.20% annual difference accumulates meaningfully when compounded, especially inside retirement or tax‑advantaged accounts.
—
2025 Trends: What’s Changing in Mutual Fund Pricing
Several structural shifts are reshaping mutual fund pricing in 2025. First, daily NAV is colliding with investor expectations of intraday transparency borrowed from ETFs and digital brokerage apps. Some markets experiment with “indicative NAV” updates during the day, especially for funds holding liquid securities, though official dealing still occurs at the end‑of‑day strike. Second, liquidity‑risk management rules are tightening, making swing pricing and anti‑dilution levies more common. Third, climate and ESG‑linked mandates introduce new valuation challenges: carbon prices, transition‑risk scenarios and physical‑risk models all feed indirectly into asset valuations and thus NAV. Pricing is no longer just market quotes; it’s a blend of data, models and policy assumptions.
—
Practical Takeaways for Investors
Putting it all together, knowing *how are mutual fund share prices calculated* is more than a trivia point; it’s a practical filter. When reviewing a fund, ask for clear documentation of its pricing and valuation policy, including swing‑pricing thresholds, use of fair‑value models and sources of evaluated prices. Compare fee structures with peers, focusing on all‑in costs rather than headline ratios. For complex bond or alternative‑strategy funds, be prepared for NAVs that move in a smoother, delayed fashion versus real‑time markets. The more your portfolio relies on such strategies, the more you should care about the plumbing behind NAV. In 2025’s data‑rich environment, opaque pricing is less a necessity and more a red flag.