

Why Your Home Energy Bills Keep Climbing (And What You Can Actually Do)
Over the last three years, residential energy costs have gone up noticeably in most countries. In the U.S., for example, average residential electricity prices rose roughly 6% in 2022 and about 3–4% in both 2023 and 2024, according to U.S. Energy Information Administration (EIA) trends. Many households now pay 15–20% more for the same number of kilowatt‑hours than they did in 2021.
At the same time, average household electricity use has stayed almost flat, which means the bill growth is mostly about higher rates, not you “wasting” tons more energy. The good news: modern home energy saving solutions can offset a big chunk of these price hikes if you apply them системно, not хаотично.
Let’s unpack the smart, technically sound ways to cut those bills without freezing in winter or sweating through summer.
Key Terms: Talking About Energy Like an Engineer (But in Human Language)
Before we dive into gadgets and upgrades, a few definitions that will keep everything clear:
– kWh (kilowatt‑hour) – Unit your utility uses to bill you. One 1,000 W heater running for 1 hour = 1 kWh.
– Thermal envelope – The combo of walls, roof, windows, doors and insulation that separates indoor and outdoor air.
– Heat loss / heat gain – How much heat leaves your home in winter or enters in summer due to poor insulation, air leaks, and solar radiation.
– COP (Coefficient of Performance) – Efficiency metric for heat pumps; COP 3 means 1 kWh of electricity produces 3 kWh of heat.
– Standby power – Electricity used by devices when they’re “off” but still plugged in (a.k.a. vampire load).
– Smart control – Automated or remote control (usually via Wi‑Fi) that adjusts devices based on temperature, schedule or occupancy.
You don’t need a degree to use these ideas, but knowing the words helps you read labels, compare devices and not fall for marketing fluff.
Big Picture: Where Your Home Energy Money Actually Goes
On average in North America and much of Europe (data 2022–2024), a “typical” electrically heated/cooling home spends roughly:
– 40–50% on heating and cooling
– 10–15% on water heating
– 10–20% on refrigeration, cooking, and kitchen appliances
– 10–15% on lighting
– 5–10% on electronics and standby loads
Your exact mix may differ, but one pattern is consistent across recent studies: HVAC (heating, ventilation, air conditioning) is still the main lever. That’s where modern smart thermostats for reducing energy bills and better building shells do the heaviest lifting.
Smart Thermostats: Small Box, Big Savings
What a Smart Thermostat Actually Does
A smart thermostat is a programmable thermostat with added features:
– Wi‑Fi connectivity (control from phone or smart speaker)
– Learning algorithms (it adapts to your schedule)
– Presence detection (via motion sensors or geofencing)
– Data logging and analytics (energy reports, runtime charts)
Instead of holding one constant temperature all day, it fine‑tunes setpoints based on whether you’re home, asleep, or away.
[Diagram: Smart Thermostat Control Loop]
Room temp sensor → Thermostat algorithm → HVAC on/off or modulate → New room temp → Back to sensor
This feedback loop is what allows smart thermostats to squeeze out extra efficiency compared to “dumb” programmable units that users often misconfigure or ignore.
How Much Do They Really Save (2022–2024 Data)
Based on aggregated field data and manufacturer‑independent studies published over the last three years:
– Typical heating + cooling savings: 8–15% vs manual thermostats
– Best‑case, well‑tuned systems: up to ~20%
If your annual HVAC cost is $1,200, saving even 10% is $120/year. With mainstream devices costing $100–$250, payback often sits around 1–2 heating/cooling seasons.
Smart vs Programmable vs Manual: Quick Comparison
Let’s compare three control “analogs” for your HVAC:
1. Manual thermostat
– You set one temperature and rarely change it.
– No schedules, no automation, high comfort, medium to high energy use.
2. Basic programmable thermostat
– Fixed schedules you program for weekdays/weekends.
– Good savings potential, but many households disable schedules after a while.
3. Smart thermostat
– Schedules + learning + occupancy + remote control.
– Tends to preserve the efficiency advantage even for “non‑technical” users.
In real‑world measurements from 2022–2024, homes that moved from programmable to smart devices still gained a few extra percentage points in savings, largely due to occupancy detection and easier user interfaces (people actually stick to using them).
Insulation and Air Sealing: The Boring Upgrade That Quietly Wins
Gadgets are cool, but your thermal envelope is still the main barrier between you and the weather.
Why It Matters Technically
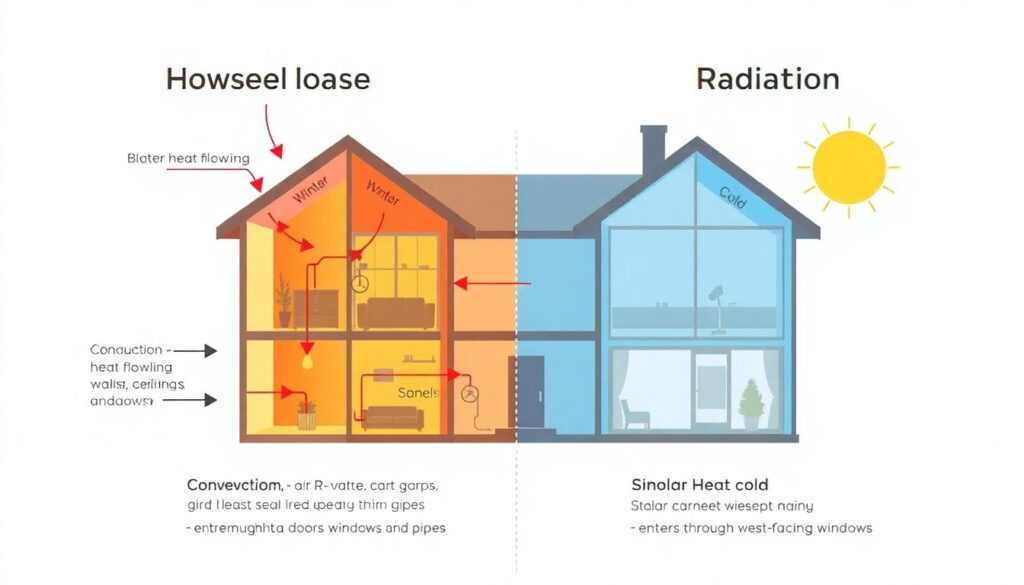
Heat flows from hot to cold. Your home loses heat in winter and gains it in summer by:
– Conduction – Through walls, ceilings, windows (governed by R‑values/U‑values)
– Convection – Through air leaks (cracks, gaps, poorly sealed penetrations)
– Radiation – Sun load through windows, especially west‑ and south‑facing
Improve the envelope, and every kilowatt‑hour you buy “stays with you” longer.
[Diagram: Heat Loss Paths in a Typical House]
Roof ↑ (through poorly insulated attic)
Walls → (through studs and uninsulated sections)
Windows → (single‑pane glass)
Floor ↓ (to crawlspace/basement)
Air leaks ○ (around doors, outlets, plumbing holes)
Measurable Gains (Recent Numbers)
According to building performance research updated through 2024:
– Air sealing plus attic insulation upgrades can reduce heating/cooling loads by 15–25% in older homes.
– Window upgrades alone typically bring 5–10% savings, sometimes more in very cold or very hot climates.
Savings here are structure‑wide and persistent; they don’t depend on replacing individual appliances later.
Appliances: Picking the Heavy Hitters First
Understanding Appliance Efficiency Labels
Modern labels (Energy Star, EU energy labels, etc.) rely on test procedures that simulate annual use. The key is to look at:
– Annual kWh consumption under standardized test conditions.
– Duty cycle (how often it runs in real life).
When choosing the best energy efficient appliances for home, start with devices that are on 24/7 or used daily:
1. Refrigerator / freezer
2. Heat pump dryer vs resistance dryer
3. Dishwasher (with eco modes and heat‑pump tech where available)
4. Induction cooktop vs old electric resistance or outdated gas ranges
5. Heat pump water heater replacing pure electric tank heaters
Over 2022–2024, the largest relative improvements have been in heat pump‑based devices: dryers and water heaters, which can cut electricity consumption by 40–60% versus older resistance‑based models.
Example: Old Fridge vs New High‑Efficiency Fridge
– 2005‑era fridge: ~600–800 kWh/year
– 2023 high‑efficiency fridge: ~300–350 kWh/year
Let’s say your local electricity rate in 2024 is $0.20/kWh:
– Old fridge: 700 kWh × $0.20 ≈ $140/year
– New fridge: 330 kWh × $0.20 ≈ $66/year
That’s ~$74/year saved, from just one appliance, with higher reliability and better temperature control.
Solar Panels for Home Electricity Savings: When the Roof Starts Working for You
How Residential Solar Works in Practice
Rooftop photovoltaic (PV) systems convert solar radiation into DC power, then an inverter turns it into AC synchronized with the grid. You either:
– Self‑consume the energy in real time, or
– Export surplus to the grid (net metering or feed‑in tariffs, where available)
[Diagram: Solar PV Flow]
Sunlight → PV panels (DC) → Inverter (AC) → Home loads ←→ Grid
From 2022–2024, solar module prices globally decreased modestly per watt, but the bigger story is that more regions now support flexible financing and community solar, making solar panels for home electricity savings accessible beyond just high‑income homeowners.
Typical Impact on Bills (Recent Data)
– In sunny regions (California, Spain, Australia), a well‑sized rooftop PV system can cover 40–80% of annual electricity use.
– Payback periods vary from 6 to 12 years, depending on incentives and local tariffs.
Because retail electricity prices have risen sharply since 2021, the *relative* value of each kWh of self‑generated solar power has increased, making 2023–2024 some of the strongest years yet for residential solar economics.
Professional Home Energy Audit: Is It Worth the Cost?
What an Audit Actually Includes
A professional home energy audit is a systematic inspection and test regime, often including:
– Blower door test (measures airtightness, in ACH50 – air changes per hour at 50 Pa pressure difference)
– Infrared thermography (identifies insulation voids and thermal bridges)
– Duct leakage testing (for forced‑air systems)
– Appliance and HVAC efficiency assessment
– Recommendations with modeled savings and rough payback times
In a nutshell, it turns guesswork into data‑driven planning.
Professional Home Energy Audit Cost (2022–2024 Ranges)
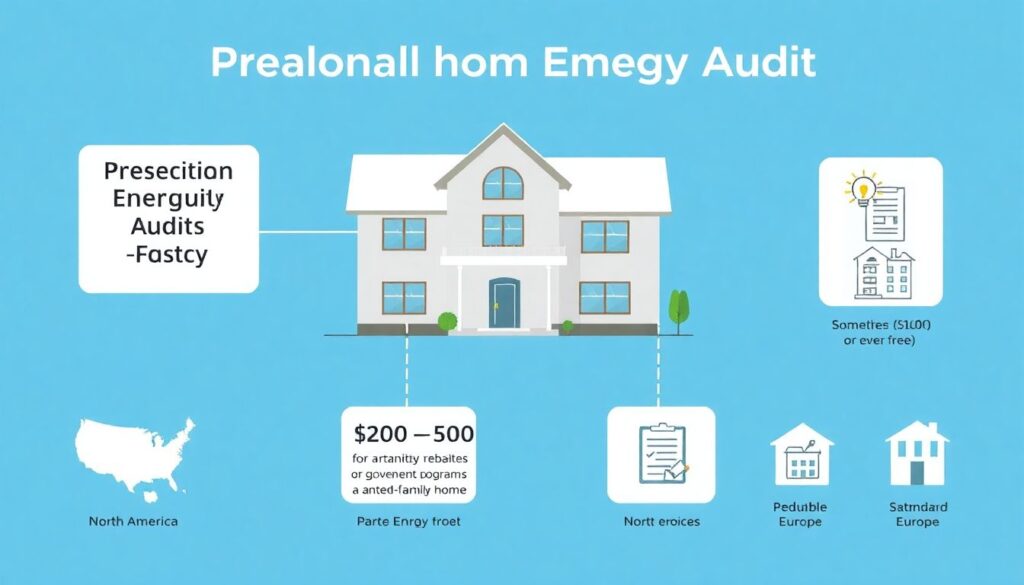
In North America and parts of Europe, typical professional home energy audit cost has been:
– Roughly $200–$600 for a standard single‑family home
– Often reduced by utility rebates or government programs, sometimes down to $100 or even free
Studies over the last three years show that when homeowners follow the top 2–3 recommendations from a thorough audit, they often reach 15–30% energy savings, depending on starting point and building vintage.
Compared to guessing which upgrades matter, the audit helps you sequence investments: air sealing before windows, or HVAC before minor gadgets, and so on.
Lighting and Standby Loads: Small Things That Add Up
LEDs: Old News, Still Huge Savings
Light‑emitting diode (LED) technology has basically won the lighting race by 2024:
– Uses ~75–85% less electricity than old incandescent bulbs.
– Lasts 10–25 times longer under typical conditions.
If you still have a lot of halogens or incandescents, the payback is often under 1 year, even with 2023–2024 bulb prices. That’s an unusually fast ROI for home improvements.
Standby Power: Finding the Vampires
Common culprits:
– TVs and game consoles in “standby”
– Routers, modems, smart speakers
– Old phone chargers, printers, microwaves with always‑on displays
For many households, total standby power is 30–80 W continuous. Over a year, that’s roughly:
30–80 W × 24 h/day × 365 ≈ 260–700 kWh/year
At $0.20/kWh, you’re talking $50–$140/year on devices “doing nothing,” which can be trimmed using smart plugs, power strips, and some deliberate unplugging.
Smart Ways to Save: A Practical 5‑Step Plan
Here’s a simple, structured approach rather than randomly buying gadgets:
1. Collect data first
– Pull 12–24 months of bills.
– Note seasonal patterns (big winter peak = heating; big summer peak = cooling).
2. Fix the envelope weak points
– Air sealing around doors/windows, attic hatches, and penetrations.
– Add attic insulation if it’s below recommended R‑value for your region.
3. Upgrade controls
– Install one or more smart thermostats for reducing energy bills, especially on central HVAC or major space heaters.
– Use smart plugs and timers for high‑standby devices and space heaters.
4. Target major appliances
– Replace the 24/7 and daily‑use items first: fridge, water heater, dryer.
– Choose models that rank as the best energy efficient appliances for home in trusted certification programs.
5. Evaluate on‑site generation
– Get quotes for rooftop PV and, if needed, batteries.
– Compare lifetime cost of solar vs projected grid prices over 20–25 years.
How These Strategies Stack Up Against “Analog” Approaches
To put things in perspective, consider two households, both trying to save:
– Household A (Random Cuts)
– Lowers thermostat a bit, occasionally turns lights off, buys one “eco” gadget on sale.
– Achieves 5–10% bill reduction, but inconsistent and annoying.
– Household B (Smart, Systemic Plan)
– Gets a basic audit (or at least follows a structured checklist).
– Prioritizes insulation/air sealing, then smart controls, then major appliances, then solar.
– Achieves 20–40% long‑term reduction, with comfort equal or better.
The difference is not just tech, it’s strategy. Systemic upgrades complement each other; piecemeal efforts often fight each other or barely move the needle.
Recent Trends: Why Acting Now Makes More Sense Than Waiting
From 2022 to 2024, several trends converged:
– Rising retail electricity and gas prices in many regions (+10–25% vs 2021 levels).
– Improved efficiency of mainstream products, especially heat pumps, LEDs, and appliances.
– Stronger incentives and financing options for solar and efficiency retrofits.
– Better data transparency via smart meters and apps.
These combine to shorten payback periods for many energy upgrades. In 2015 a lot of projects looked “nice but marginal.” In 2024, the same projects often show much more attractive internal rates of return, especially if you expect tariffs to keep climbing.
Wrapping Up: Turning Tech into Tangible Savings
You don’t have to install every gadget on the market or rebuild your house from scratch. The key is to:
– Understand where your energy goes.
– Fix the building shell so energy isn’t wasted.
– Use smart controls to adapt to your actual lifestyle.
– Replace the worst‑offender appliances first.
– Add solar when the numbers (and roof) make sense.
If you treat your home like a small, data‑driven energy system instead of a mysterious black box, those rising bills become much more manageable—and your comfort, oddly enough, usually improves along the way.