
Understand the Purpose Behind the Budget Report

Before diving into numbers, clarify the intent of the budget report. Is it for internal expense tracking, external investor review, or government compliance? Each use case affects how the report is structured and what details are emphasized.
A budget report typically compares projected (budgeted) financial figures with actual performance over a specific period. It helps identify variances, assess financial health, and inform future decision-making.
Familiarize Yourself with Key Components
Professional budget reports often include the following sections:
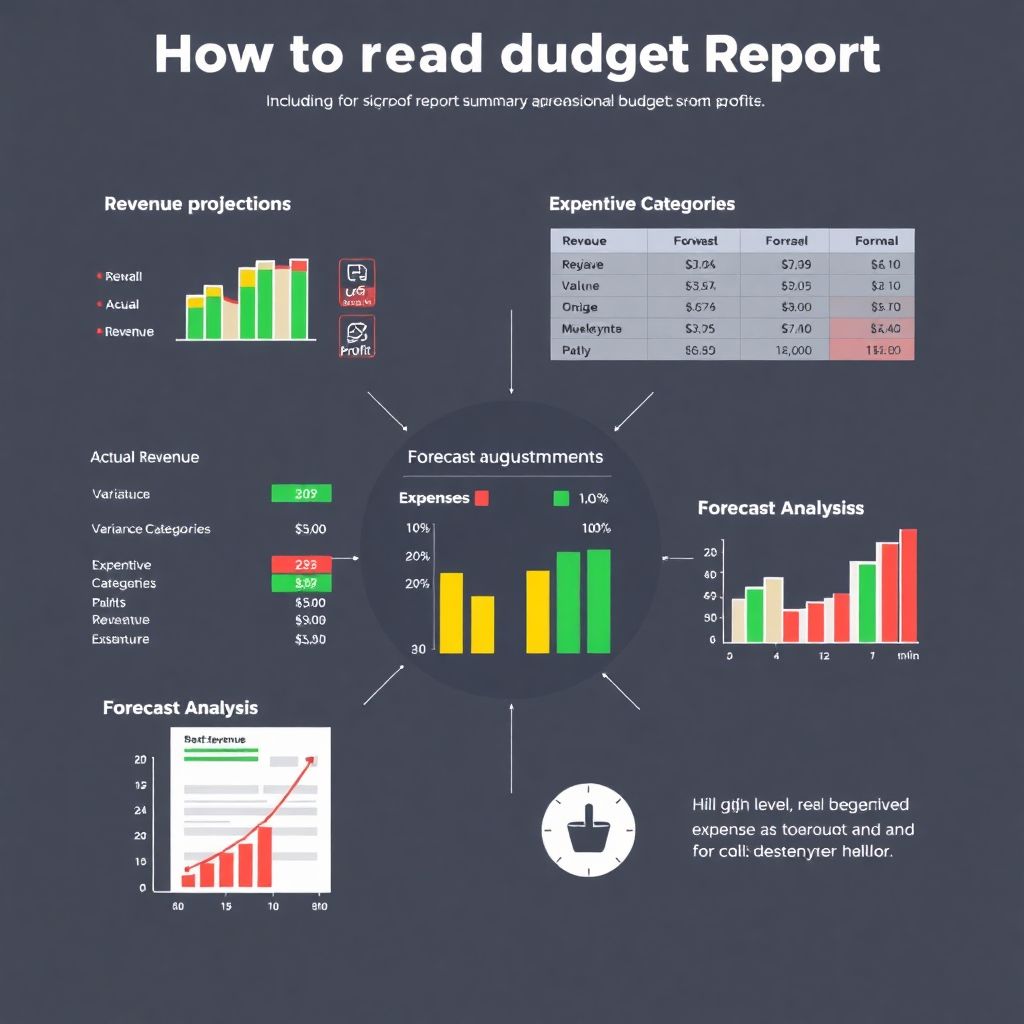
– Revenue Projections: Expected income from various sources.
– Actual Revenue: Real income received during the period.
– Expenditure Categories: Budgeted versus actual costs, often broken down by departments or projects.
– Variance Analysis: Differences between budgeted and actual figures, usually shown in both absolute numbers and percentages.
– Forecast Adjustments: Revisions for future periods based on performance trends.
Understanding these components is essential to interpret the report accurately.
Step 1: Start with the Executive Summary
Many professional reports begin with a high-level summary. This section outlines the overall financial performance, major deviations, and key takeaways. Pay attention to:
– Total revenue vs. budgeted revenue
– Total expenses vs. budgeted expenses
– Net profit or loss
– Any significant one-time events affecting the results
A 2023 Deloitte survey found that 78% of CFOs rely heavily on the executive summary for quick decision-making, underscoring its importance.
Step 2: Analyze Revenue Variances
Compare projected revenue streams with actual figures. Look for:
– Overperformance: Did a product line exceed expectations? Why?
– Underperformance: Were there market shifts, delays, or pricing issues?
– Timing differences: Did revenue arrive earlier or later than planned?
Between 2022 and 2024, 62% of mid-market firms reported significant revenue variances due to delayed customer payments, according to a 2024 EY Financial Insights report.
Step 3: Scrutinize Expenditures

Expenses often reveal more about operational efficiency than revenue. Examine both fixed and variable costs.
– Are administrative costs aligned with projections?
– Did marketing spend exceed the budget, and was it effective?
– Were there unplanned capital expenditures?
Be wary of buried costs. For example, software subscriptions and consulting fees can inflate monthly expenses subtly if not categorized properly.
Step 4: Focus on Variance Analysis
Variance analysis is where professionals distinguish themselves. Look beyond the numbers:
– Identify patterns: Are certain departments consistently overspending?
– Question assumptions: Was the budget realistic, or too optimistic?
– Investigate root causes: Don’t settle for surface-level explanations.
A 2024 McKinsey report noted that companies with real-time variance tracking reduced forecasting errors by 27% over three years.
Step 5: Review Forecast Adjustments
Budget reports often include revised forecasts. These updates reflect current realities and inform future planning.
Ask yourself:
– Are future revenues adjusted based on realistic trends?
– Have cost-cutting measures been introduced?
– Is there a contingency plan for further deviations?
Forecast revisions are not a sign of failure—they’re a sign of responsive management.
Common Mistakes to Avoid
Even experienced professionals can fall into traps when reading budget reports:
– Ignoring context: A 10% overspend may be justified if it led to a 20% revenue increase.
– Focusing only on totals: Department-level insights often reveal the real story.
– Assuming variance is always bad: Sometimes, spending more yields long-term gains.
Tips for Beginners
If you’re new to budget analysis, keep these strategies in mind:
– Use color coding: Green for positive variances, red for negative—visual cues help.
– Ask questions: Don’t hesitate to consult department heads or accountants.
– Keep a glossary: Financial terms can be confusing; build your own reference.
Use Historical Benchmarks for Perspective
Compare current data to past years to identify trends. For example:
– In 2022, average operating expenses for U.S. SMEs were 68% of total revenue.
– In 2023, this dropped to 65% due to post-pandemic cost optimization.
– By 2024, the figure rose slightly to 66%, reflecting inflationary pressures.
Such benchmarks provide valuable context and help separate anomalies from systemic issues.
Final Thought: Read Between the Lines

Reading a budget report like a pro requires more than number crunching. It demands critical thinking, contextual awareness, and a keen eye for detail. The real insights often lie not in what’s presented—but in what’s missing, misaligned, or misinterpreted.
By following a structured, analytical approach, you can transform a routine financial document into a powerful decision-making tool.