
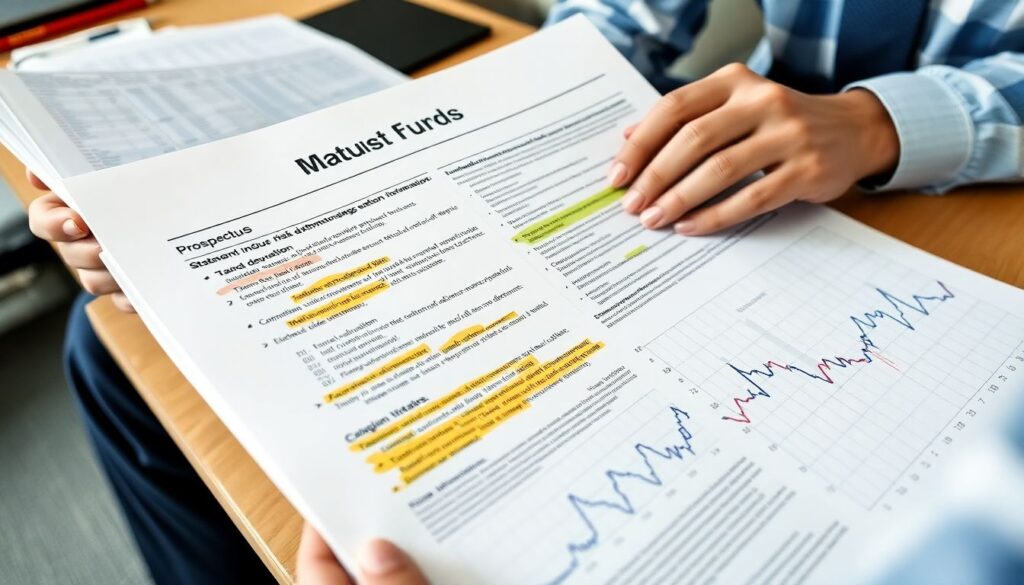
Why the Prospectus Matters (And Isn’t Just Legal Junk)
Most investors treat the mutual fund prospectus like those “Terms & Conditions” pop‑ups: scroll, click, forget. Yet this document quietly decides your returns, your risks and even how much tax you’ll pay. Over the last three years, the average U.S. equity mutual fund expense ratio has hovered around 0.47–0.50% (ICI data 2022–2024), which sounds tiny until you realize that over 20–30 years it can eat tens of thousands of dollars. Reading a prospectus like a pro is about spotting those silent leaks and understanding what you’re actually buying instead of just chasing a catchy fund name or a 5‑star rating you saw on a blog.
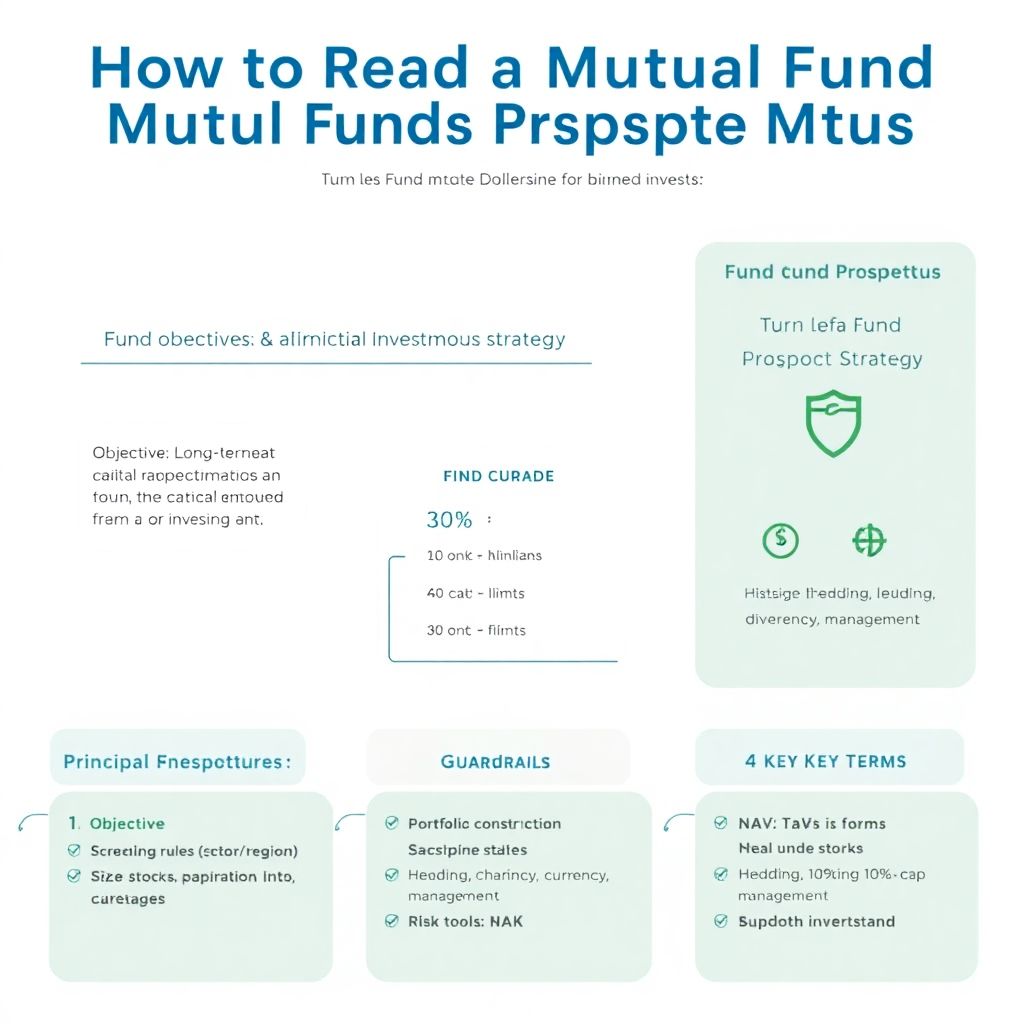
Step 1: Decode the Fund’s Objective and Strategy
The first thing you’ll see is a short section like “Investment Objective” or “Goal.” It might say something bland like “long‑term capital appreciation” or “current income.” On its own, that’s too vague to help, so dive into the “Principal Investment Strategies” right below. This is where the fund explains what it really does day to day: which asset classes, which regions, how concentrated the portfolio is and whether it can use derivatives or leverage. Over 2022–2024, funds marketed as “growth” have shown wider performance swings than “value” or “balanced” funds, so the label truly matters. Don’t assume “growth” equals “best” — it just means higher emphasis on companies expected to expand quickly, with more volatility.
Text Diagram: Translating the Strategy Section
Think of the strategy part as a small flowchart describing how your money is deployed:
[Diagram: Cash → (Screening rules: size, sector, region) → (Portfolio construction: 40–80 stocks, position limits) → (Risk tools: hedging, diversification, currency management)]. If the prospectus says “normally invests at least 80% of assets in U.S. large‑cap stocks,” that 80% is a key constraint, almost like guardrails on a highway. When you’re researching the best mutual funds to invest in 2025, check that these guardrails match your expectations: a “U.S. equity” fund that can park 35% in foreign small caps is a very different beast from a truly domestic large‑cap fund.
Step 2: Key Terms You Must Understand
Prospectuses are sprinkled with jargon, but a handful of terms do most of the heavy lifting. “Net asset value (NAV)” is simply the per‑share value of the fund at the end of each trading day: (total assets – liabilities) ÷ shares. “Turnover rate” tells you how often the fund trades; a 100% turnover roughly means the portfolio gets reshuffled every year. Higher turnover usually means higher trading costs and potentially more taxable distributions. From 2022 to 2024, equity funds with turnover above 100% have, on average, distributed more taxable capital gains than low‑turnover index funds, which directly affects after‑tax returns for investors in taxable accounts.
Short Glossary in Plain English
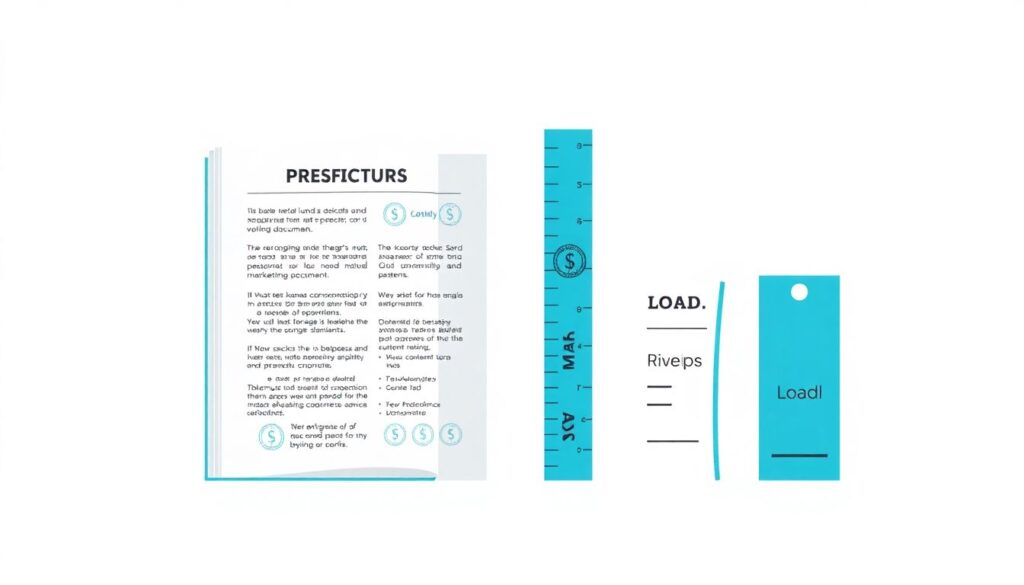
“Prospectus” is the official legal and marketing document that describes the mutual fund and must be filed with regulators. “Benchmark” is the yardstick the fund uses to judge its own performance, like the S&P 500 for U.S. large‑cap stocks. “Load” means a sales commission charged when you buy or sell the fund; “no‑load” funds don’t have these commissions but may still have ongoing costs. “12b‑1 fee” is a marketing and distribution fee sneaked into ongoing expenses. When you’re figuring out how to choose mutual funds for beginners, properly understanding these concepts will do far more for your results than memorizing fancy ratios.
Step 3: Mutual Fund Fees and Expenses Explained in Real Money
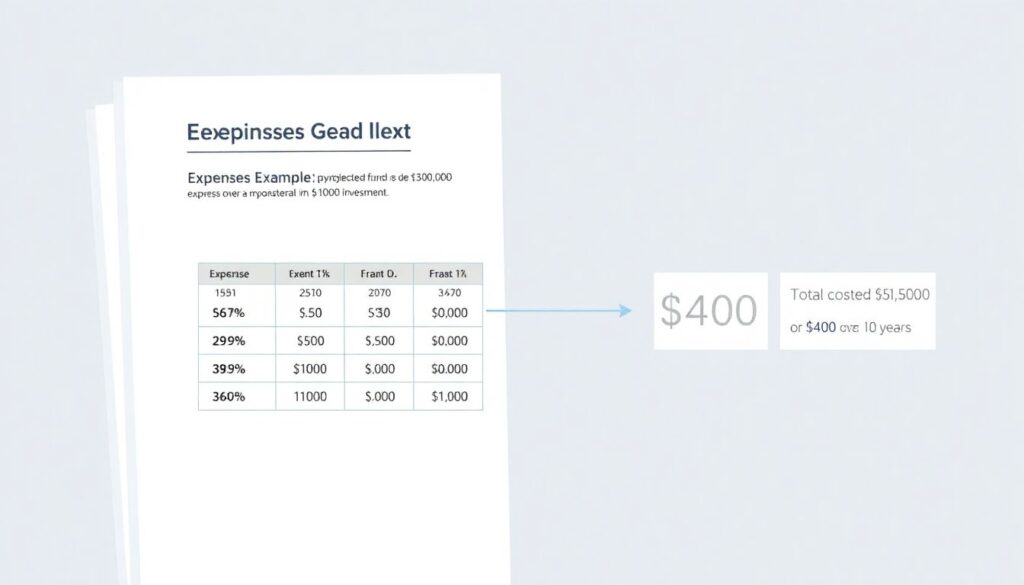
The expenses section is where your long‑term performance lives or dies. You’ll usually see an “expense example” that projects what you’d pay over 1, 3, 5 and 10 years on a hypothetical $10,000 investment. Use that as a reality check: if it shows $1,500 over 10 years for one fund and $400 for another similar option, the difference is enormous once you factor compound growth. Between 2022 and 2024, ICI data show investors have steadily migrated into lower‑cost funds; index mutual funds and ETFs now represent well over half of U.S. equity fund assets, largely because their fees can be under 0.10%, compared with many active funds still charging 0.75% or more.
Diagram: Where Every Dollar of Expense Goes
Visualize the annual fee structure as a pie:
[Diagram: Management fee (portfolio team) – biggest slice; 12b‑1/marketing fee – smaller slice; Other operating costs (custody, accounting, admin) – thin slice; Trading costs – invisible but real slice outside the pie]. The prospectus discloses the first three in the “expense ratio,” but trading costs only show indirectly, often through turnover. When you see a fund with a 1.2% expense ratio and 150% turnover, assume there’s more drag than the headline suggests. This is why mutual fund comparison tools online usually highlight expense ratios and turnover near the top of their results screens.
Step 4: Risk Section — Not Just Scary Legal Boilerplate
The “Principal Risks” section can read like a horror novel: market risk, credit risk, liquidity risk, currency risk, and so on. Instead of skimming, tie each risk back to the strategy you already reviewed. If the fund can invest up to 30% in emerging markets, then “emerging market risk” isn’t a footnote; it’s a real driver of behavior in a crisis. Data from 2022–2024 show that emerging‑markets equity funds had roughly 1.3–1.6 times the volatility of broad U.S. equity funds, and during sharp pullbacks they tended to fall more. Reading this section carefully helps you avoid being “surprised” by losses that were, in fact, disclosed from the start.
Comparing Risk Across Funds
To compare risks organically, look for the parts of the prospectus summarizing “standard deviation,” “beta” or “downside risk” in the performance discussion or the Statement of Additional Information. When paired with the benchmark description, they give you a rough sense of how bumpy the ride might be. A beta of 1.2 versus the S&P 500 suggests the fund typically moves 20% more than the index, both up and down. In the last three years many investors have chased higher‑risk sector funds after seeing spectacular one‑year returns, only to underperform broader funds over the full 2022–2024 window when volatility normalized.
Step 5: Performance Charts — Reading Them Without Getting Hypnotized
Performance sections often show a bar chart of annual returns, a table of 1‑, 5‑ and 10‑year performance and sometimes “since inception.” The crucial move is to compare the fund against both its stated benchmark and its category peers. From 2022 through 2024, dispersion between the best and worst active U.S. equity funds in the same category often exceeded 10 percentage points per year, meaning simply picking “an active fund” isn’t enough. Check whether strong returns come from one monster year or consistent outperformance. A single blowout 2023 followed by lagging 2024 might indicate a style tilt that temporarily got lucky, not durable skill.
Diagram: Separating Skill from Luck
Imagine a simple three‑line sketch:
[Diagram: Line A – Fund performance; Line B – Benchmark index; Line C – Category average]. If Line A hugs Line B but slightly above it over multiple years, that suggests modest, consistent alpha after fees. If Line A swings wildly above and below Line B, you’re looking at a high‑beta or concentrated strategy where timing matters a lot more. Many investors researching the best mutual funds to invest in 2025 focus solely on Line A, forgetting that long‑term success depends on how reliably the fund beats both Line B and Line C, not just whether it once posted a headline‑worthy year.
Step 6: Portfolio Holdings and Turnover — Seeing What’s Under the Hood
The holdings section tells you where your money actually ends up. Prospectuses usually show the top 10 holdings and sometimes sector and region breakdowns. Use it to avoid “closet indexers” — active funds that hug the benchmark but still charge high fees. From 2022–2024, academic studies and industry research repeatedly found that many large‑cap active funds had more than 80% overlap with the S&P 500 yet lagged after costs. Look for concentration: if the top 10 positions make up 50% of assets, you’re taking stock‑specific risk; if they’re 20%, you’re leaning more on broad diversification. Neither is “better,” but you should know which you’re signing up for.
Turnover and Taxes in Practice
Turnover deserves special attention if you invest outside tax‑advantaged accounts. U.S. equity index funds often show turnover below 10%, while some aggressive active funds exceed 150%. IRS statistics and fund company reports from 2022–2024 indicate that high‑turnover funds distributed significantly larger capital gains per share, even in years when overall markets were only modestly positive. That means you can owe taxes despite not selling any shares yourself. Prospectuses sometimes illustrate this by showing historical distribution data; when paired with turnover, that gives you a realistic sense of the fund’s “tax drag.” It’s one more reason many long‑term investors favor simpler, lower‑turnover strategies.
Step 7: Share Classes, Loads and Sales Charges
If you see Class A, C, I or R shares in the prospectus, they all own the same portfolio but have different pricing structures. Class A often has a front‑end load (e.g., 5.75%) but lower ongoing expenses; Class C may skip the upfront hit but charge more every year and sometimes add a deferred sales charge if you sell early. Over a 10‑year holding period, the higher annual fee of Class C can easily cost more than the initial load of Class A, which the expense example in the prospectus will usually illustrate. Institutional or “I” shares generally have the lowest fees but higher minimums, making them better for larger accounts or retirement plans.
When a Human Advisor Makes Sense
If this all feels overwhelming, a financial advisor for mutual fund investments can be worth the cost, provided the relationship is transparent. A fee‑only advisor who charges a flat fee or percentage of assets and uses low‑cost funds may leave you better off than a “free” advisor paid by fund commissions. When interviewing advisors, literally bring a prospectus and ask them to walk you through the fees, risks and performance. Their ability to explain those moving parts clearly — and to justify their own compensation relative to fund costs — is a powerful filter for who deserves your trust.
Step 8: Using Online Tools Together with the Prospectus
Reading prospectuses gets easier when you pair them with mutual fund comparison tools online. Screens from Morningstar, fund company sites or broker platforms let you quickly line up expense ratios, historical returns and category ranks, then you jump into the prospectus for the deeper story. Over 2022–2024, investors have increasingly relied on digital research; brokerage reports show double‑digit annual growth in online fund screenings and downloads of electronic prospectuses. The healthiest workflow is simple: shortlist with tools, verify with the official document. That way, you avoid being seduced by marketing metrics like star ratings without understanding the risks, costs and strategy that actually produce those stars.
How Beginners Can Turn Prospectuses into an Edge
If you’re wondering how to choose mutual funds for beginners without blowing up your savings, think in layers. Start with basics — low fees, diversified strategy, clear objective you can explain in one sentence — then use the prospectus to check for red flags: high loads, confusing risk language, or aggressive turnover. Over the past three years, low‑cost broad market funds have continued to outperform a majority of high‑fee active peers after expenses, especially over longer horizons, according to SPIVA and similar scorecards. You don’t need to predict markets; you just need to avoid avoidable mistakes hiding in plain sight in the document most people never read.
Final Checklist Before You Invest
Before putting money into any fund, open the prospectus and confirm six things: 1) Objective and strategy match your goal and time horizon. 2) Total expenses, including loads and 12b‑1 fees, are reasonable for the category. 3) Principal risks line up with your risk tolerance and you’re not surprised by leverage or derivatives. 4) Long‑term performance versus benchmark and peers is acceptable, not just one great year. 5) Holdings and turnover reflect the level of concentration and tax efficiency you want. 6) The share class you’re buying is the right one for your situation. Do that consistently and you’ll already be reading mutual fund prospectuses at a level most investors never reach.