
Why Your Investment Fees Deserve More Attention
Most people focus on returns and barely glance at costs, yet fees quietly decide who gets rich: you or your provider. Think of them as friction: small in the moment, brutal over decades. With investment fees explained clearly, it becomes obvious why a “tiny” 1–2% annual charge can consume a third of your final nest egg over 30 years. The twist is that fees are often hidden in jargon, layered products and glossy marketing. To navigate this, you need a practical mental model, not a PhD in finance, plus a few simple tools and habits to keep costs under control.
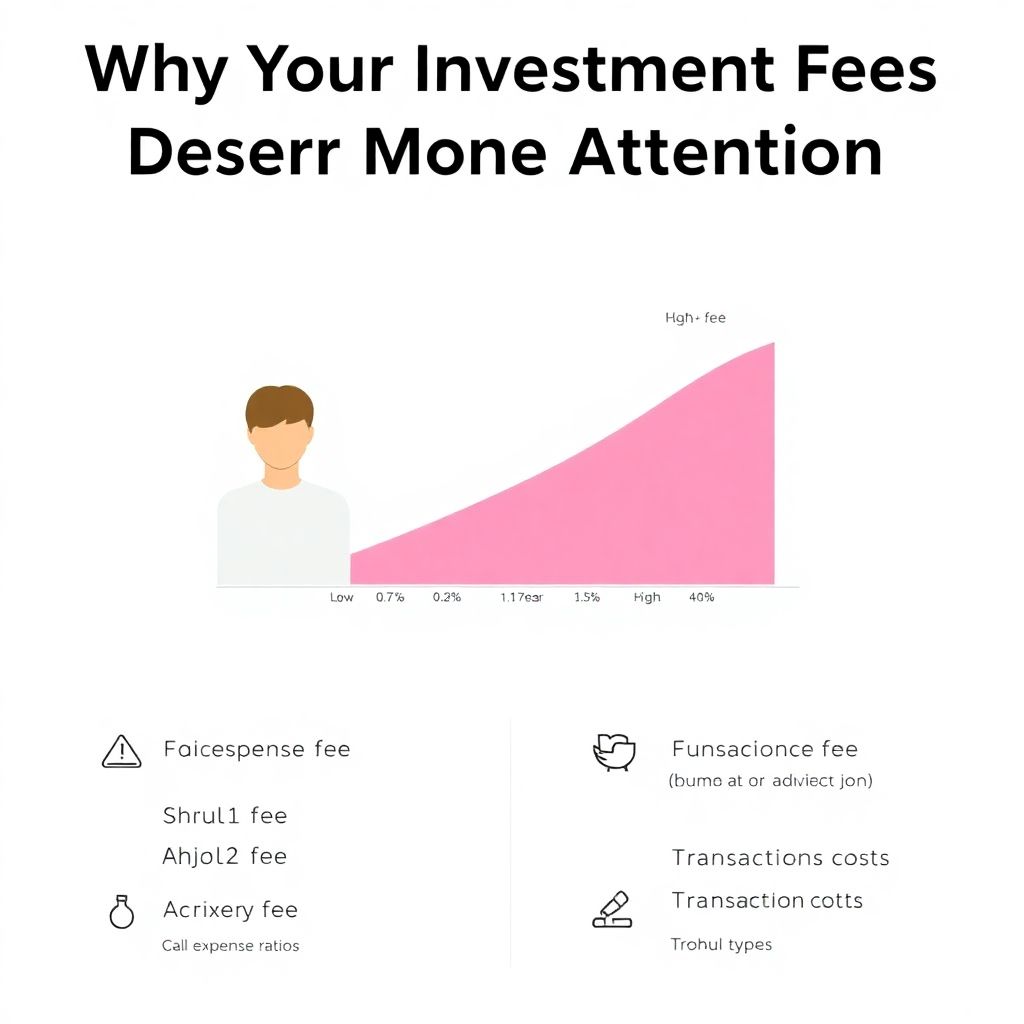
Main Types of Investment Fees You Actually Pay
Most charges fall into four buckets. First, fund expense ratios: a percentage skimmed from your assets inside mutual funds or ETFs, deducted daily and almost invisible. Second, advisory fees, where a human or robo-advisor bills, say, 1% of assets each year. Third, transaction costs: brokerage commissions, spreads and sometimes platform fees. Finally, product-level extras like performance fees on hedge funds or structured products. Once you learn to read a fact sheet and a fee schedule, you can compare investment management fees across providers instead of trusting sales pitches.
Real Case: The “Cheap” Fund That Wasn’t
Emma, 32, thought she had a bargain: a “no-load” mutual fund in her retirement account. No upfront sales load sounded perfect. But she overlooked a 1.7% annual expense ratio plus a 0.25% marketing fee quietly labeled 12b‑1. Over 25 years, assuming 6% gross returns, her effective net return was closer to 4%. A colleague used a low-cost index ETF at 0.08%. Projected forward, Emma’s final balance was about 30–35% smaller than it could have been. It felt like losing a third of her savings to nothing more than poorly understood costs and a lack of early scrutiny.
What the Numbers Say About Fee Impact
Empirical data is blunt: fees are one of the most reliable predictors of future underperformance. Studies by Morningstar repeatedly show that, across categories, low-fee funds tend to outperform their pricier peers after costs. A simple example: invest $10,000 for 30 years at 7% with a 0.1% fee versus 1.5%. The low-fee choice grows to roughly $72,000; the high-fee option lands near $45,000. That’s not a small leak, it’s a structural drain. This is why regulators now push for clearer investment fees explained on statements and product documents.
Macro and Economic Angles of Fee Drag
High fees do not just hurt individuals; they have macro consequences. When millions of savers overpay, aggregate retirement wealth shrinks, pressuring future public finances and social safety nets. Capital also gets misallocated: expensive, actively managed products attract flows not because they add economic value but thanks to aggressive distribution. Lowering systemic costs frees more capital for productive investment, supporting long-term growth. Economists increasingly treat excessive fees as a “rent extraction” problem, where intermediation absorbs more of the return than is justified by actual skill or risk reduction.
Forecasts: Where Fee Levels Are Headed
Structural forces are pushing costs down. The rise of index investing, transparency rules and digital brokerage platforms has created a race to the bottom on visible charges. Global ETF fees have trended lower for a decade, with core index funds now near zero in some markets. Forecasts from major consulting firms suggest average retail investment costs could fall another 20–30% over the next ten years. However, providers may respond by adding new, harder-to-spot fees around advice, “premium” services and complex products, shifting where, rather than whether, they get paid.
Case Study: From 1.5% to 0.25% All-In Costs
Carlos, 40, had $150,000 invested with a traditional advisor charging 1% annually, mostly in active mutual funds averaging 0.7% in expenses. All-in, he paid about 1.7% per year, or roughly $2,550 in year one. After learning how to reduce investment fees, he moved to a hybrid model: a low-cost robo-advisor plus a flat-fee planner for periodic checkups. His new all-in cost was about 0.25%. On a projected 25-year horizon, the fee savings alone were worth tens of thousands of dollars, without increasing risk—just by eliminating unnecessary layers of intermediation.
How to Actually See What You’re Paying
Your first task is to uncover the full fee stack. Start with account statements and fund fact sheets: find the expense ratio, any advisory percentage, plus trading and platform charges. If you use a professional, ask them to itemize every dollar you paid last year, including indirect product costs. An investment advisor fees calculator can help translate percentages into hard cash and future impact, which is far more intuitive. When people see that “just 1%” could equal a new car every decade, their willingness to challenge fees suddenly increases.
Using Comparisons to Build Negotiation Power
Raw numbers become persuasive when contextualized. To compare investment management fees effectively, line up your current portfolio costs against a realistic low-cost alternative: for example, a diversified set of index ETFs plus a modest planning fee. Check what leading robo-advisors and discount brokers charge for similar asset mixes. If you discover you’re paying, say, 1.8% versus 0.3% elsewhere, you have a concrete basis to negotiate or switch. Some advisors will lower their rate rather than lose a client, especially if you demonstrate you’ve done your homework and know the benchmarks.
Platforms and the New Fee Landscape
Digital brokers and robo-advisors have transformed how we buy investments and what we pay. The best low fee investment platforms typically offer zero-commission trading, low or no account minimums and access to ultra-cheap index funds. However, “free” trading does not mean free investing. Platforms may monetize order flow, margin lending or premium features. The practical move is to look at your total cost of ownership: underlying fund fees, spreads, FX margins and any add-on subscriptions. Often, the big gains come from choosing simple building blocks rather than exotic tools.
Industry Impact: Pressure and Innovation
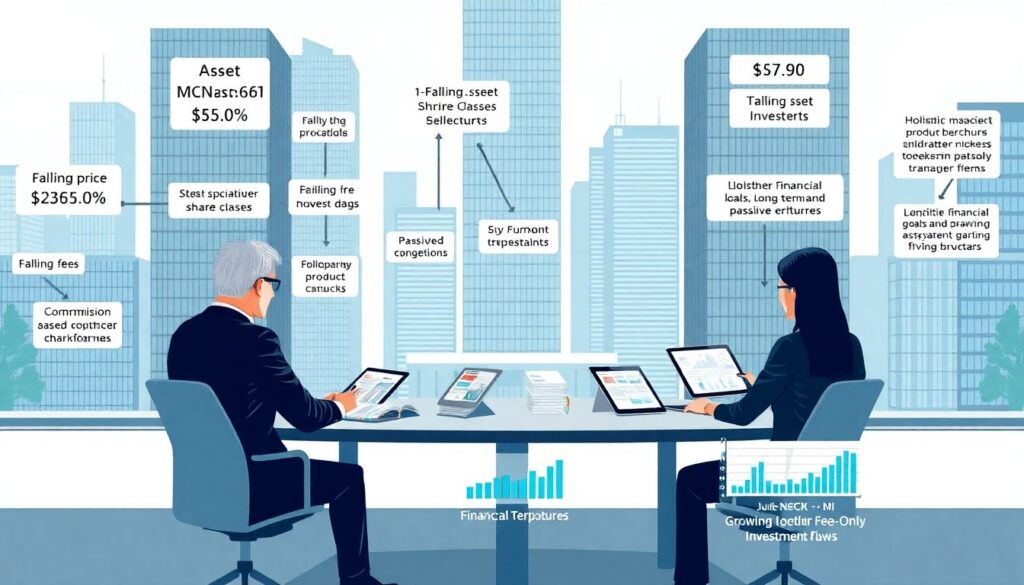
Fee compression is reshaping the investment industry. Asset managers once comfortable charging over 1% are launching cheaper share classes and passive ranges to defend market share. Advisors are shifting from commission-based selling to fee-only planning, emphasizing holistic advice over product selection. At the same time, some firms push high-margin “solutions” such as complex structured notes. The net effect is a barbell: ultra-low-cost beta on one side, premium, hard-to-evaluate offerings on the other. For investors, this mix raises both opportunities and the risk of new, opaque expense structures.
Behavioral Traps That Keep Fees High
Even when people intellectually know that costs matter, behavior gets in the way. Brand loyalty, inertia and overconfidence in star managers often trump rational fee scrutiny. Many investors equate higher fees with better quality, a bias borrowed from consumer goods that does not translate well to markets. There’s also an attention problem: fee details are boring, so we avoid them. Recognizing these biases is the first step. Automating good habits—such as annual fee reviews and defaulting to low-cost funds unless there is strong evidence otherwise—helps bypass emotional decision-making.
Practical Steps to Reduce Your Investment Fees
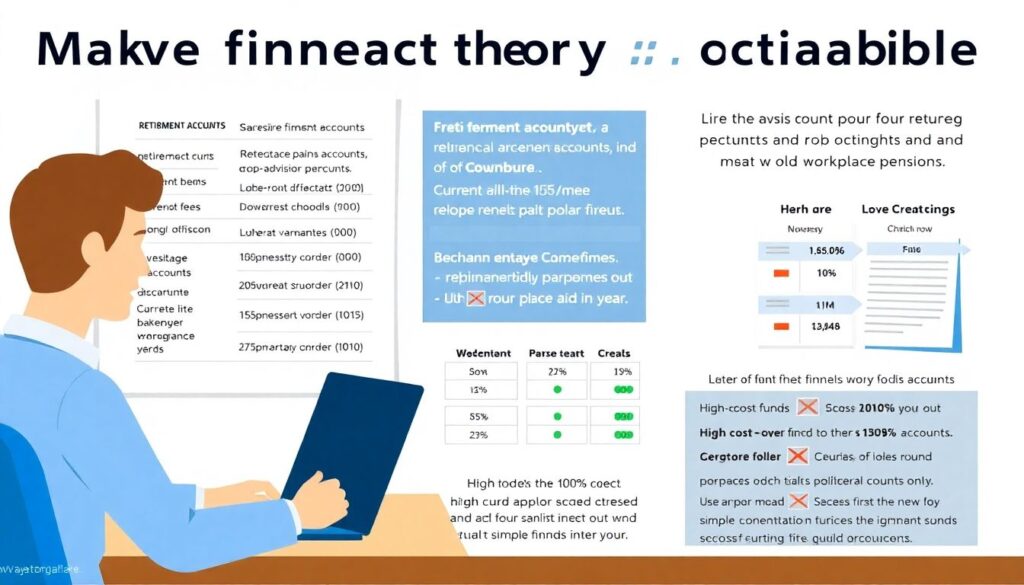
To make theory actionable, start with an inventory of all accounts: retirement plans, brokerage, robo-advisors, even old workplace pensions. For each, list the current all-in percentage and approximate dollars paid per year. Then, systematically replace high-cost funds with lower-cost equivalents in the same asset class, keeping your risk profile intact. Consolidate stray accounts where possible to avoid redundant platform charges. If you value human advice, consider negotiating a lower AUM fee or switching to a fixed or hourly planning model. The goal is not zero cost, but fair, transparent pricing.
Case Study: DIY vs. Full-Service Advisor
Lena, 55, considered firing her advisor to go fully DIY. Her $500,000 portfolio incurred a 0.9% advisory fee plus 0.4% in average fund costs. After research, she realized she could build a similar ETF portfolio at 0.1% expenses and use a planner for $2,000 per year. All-in, that was about 0.5%, cutting her ongoing cost nearly in half. Still, she valued behavioral coaching during market stress, so she retained the advisor but demanded a 0.6% fee and cheaper funds. The compromise preserved guidance while capturing most of the savings.
Putting It All Together
Understanding fees is less about mastering formulas and more about cultivating a skeptical, curious mindset. Once you grasp the compounding effect of costs, you will never look at a “small” percentage the same way again. Use tools like an investment advisor fees calculator, online fund screeners and public disclosures to benchmark what you pay. Remember: markets are uncertain, but fees are guaranteed. Treat them as a controllable risk factor. Shrinking that drag, year after year, is one of the most reliable ways to tilt long-term investment outcomes in your favor.