
A Brief History of Money Tracking in Excel
From Notebooks to Dynamic Dashboards
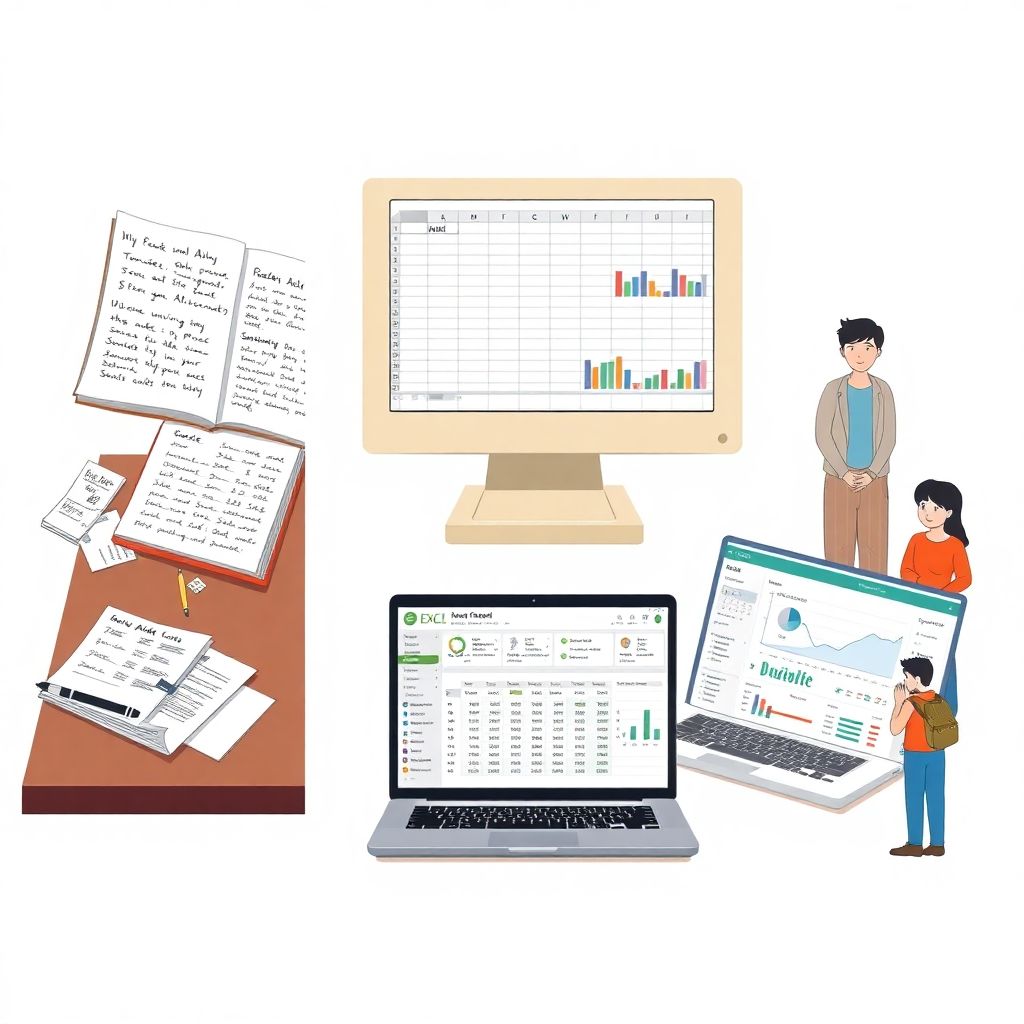
Long before anyone typed a formula, people tracked money in paper notebooks: dates, amounts, and hurried notes in the margins. With the spread of PCs in the 80s and 90s, spreadsheets replaced those ledgers, and Excel quietly became the default tool for home budgeting. At first, it was just digital graph paper: columns for expenses, a few sums at the bottom. Over time, built‑in charts, conditional formatting and pivot tables turned Excel into a flexible analytics tool. This evolution is what made a modern personal finance dashboard possible: instead of flipping through pages or scrolling endless lists, you compress your entire financial life into one screen with clear indicators, visuals, and trends that help you make decisions quickly rather than guess.
Why Excel Still Matters Today
Even with dozens of apps around, Excel keeps winning for budgets because it’s transparent. You see every formula, every cell, and you decide what gets tracked, how it’s calculated, and where the data lives. No surprise category changes, no paywalls to “unlock” basic reports. If you’re thinking about a personal finance dashboard template excel might not sound as shiny as a new mobile app, but it’s far more customizable: you can adapt it to local currencies, unusual income sources, or specific goals like a house renovation or visa fund. You’re not stuck with one company’s idea of “normal” spending; you build the model around your real life.
Core Principles of a Good Finance Dashboard
Start with Clear Goals, Not with Formulas

Before you touch a cell, decide what your dashboard must answer in five seconds. Common goals: “Can I safely spend this weekend?”, “Am I on track for my yearly savings target?”, “Which category is leaking the most money this month?” Write down 3–5 questions like that. They will dictate what data to collect and how to layout your sheets. Without this, people jump straight into complex formulas and end up with colorful chaos. When you later search for the best personal budget planner excel can provide, you’ll evaluate any structure against those questions: if the template doesn’t answer them instantly, it’s not right for you, no matter how pretty the charts are.
Think in Data Layers, Not Random Tabs
A solid dashboard usually has three layers: raw data, calculations, and the actual visual panel. Raw data is every transaction with date, category, account, and amount. Calculations are helper columns: month, year, cashflow by category, running balances, savings rate. The panel is where you use charts, summary cards, and slicers. If you keep this layered mindset, you avoid mixing inputs with formulas, which is where most home‑made budgets break. It also makes later automation easier: when you learn how to create personal finance spreadsheet in excel with imports from bank exports, you’ll plug that into the raw data layer without rewriting the rest.
Practical Implementation: From Blank Sheet to Dashboard
Step‑by‑Step: Basic Personal Dashboard
Imagine you’re Alex, a mid‑level employee with one salary account and one credit card. You want to stop “mystery disappearing money” at the end of each month. Start with a “Transactions” sheet: columns Date, Description, Category, Account, Amount (positive for income, negative for expenses). Enter at least three months of data — manual typing from bank statements is fine for the first setup. Add a “Month” column with a formula that extracts month and year from the date. Then create a “Summary” sheet. Use SUMIFS to total expenses and income by month and by category. Add simple charts: total monthly savings, top‑5 categories by spending. With a couple of slicers (for account or category) you already have a usable dashboard that tells Alex exactly where the salary goes.
Real Case: Freelance Designer with Irregular Income
Now take Mia, a freelance designer juggling multiple clients, currencies, and irregular invoices. She needs more than a standard excel budget template download because her income is lumpy and she has tax obligations. Mia builds separate sheets: “Transactions,” “Invoices,” and “Taxes.” In “Invoices,” she tracks issue date, due date, client, status, and amount; in “Transactions,” she logs actual cash movements. A pivot table links paid invoices to months, showing earnings volatility. Another calculation estimates tax liability as a percentage of profit and displays it on the dashboard as “Tax to set aside this month.” For Mia, the dashboard becomes a risk radar: it highlights months where expected invoices haven’t been paid yet, so she can follow up or delay a big purchase, instead of being surprised at tax time.
Templates, Automation, and Smart Shortcuts
When to Use Templates and When to Build Your Own
You don’t have to reinvent every formula. A well‑made excel personal finance tracker template free can save hours, especially for standard elements like monthly summaries and charts. But use templates as scaffolding, not as an unchangeable shrine. Import one, then rename categories to match your life, delete features you don’t understand, and only keep what you can explain in plain language. If a chart looks cool but you can’t say “this shows X vs Y, and I use it when deciding Z,” remove it. Over time, your file becomes a hybrid: partly based on a template, partly your own tweaks. That hybrid is far more useful than a generic, untouched download.
Light Automation for Daily Use
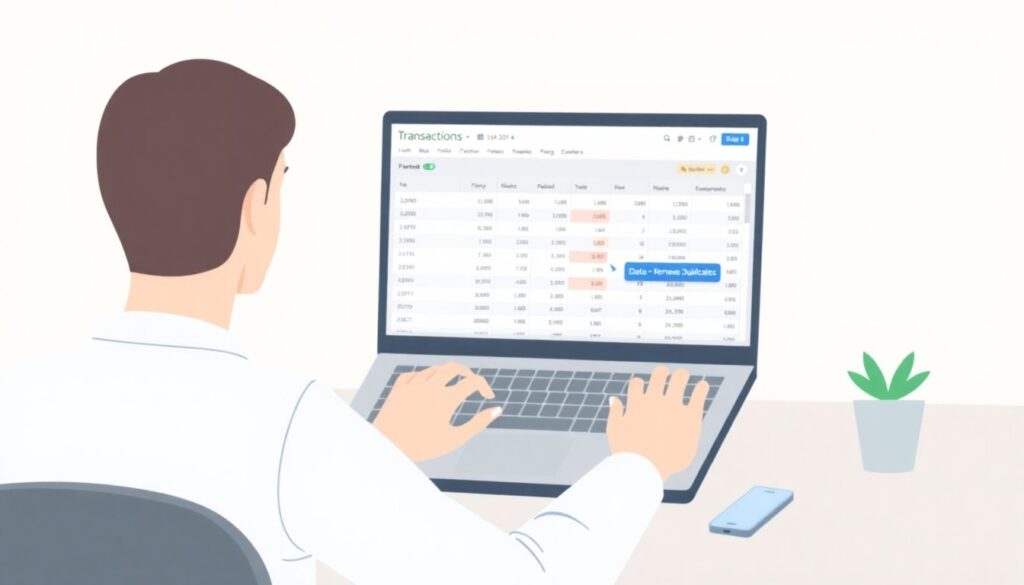
A dashboard is only helpful if you actually keep it updated. To reduce friction, create a simple routine. Once a week, copy transactions from your bank’s CSV export into the “Transactions” sheet; use Data > Remove Duplicates if you’re worried about overlaps. Add a few data validation drop‑downs for categories so you’re not typing “Groceries” three different ways. If you’re comfortable, record a macro that formats new rows and refreshes all pivots and charts with one click. For some people, this light automation is the difference between a dashboard they maintain all year and a file they abandon in March, when enthusiasm fades and manual work becomes annoying.
Case Studies: How Dashboards Change Behavior
Family Budget: Turning Arguments into Numbers
A couple, Sam and Elena, were constantly arguing about “who spends more.” They had tried apps but gave up because the categories felt too restrictive. They decided to build their own structure instead of hunting endlessly for the perfect personal finance dashboard template excel might offer. Together they defined joint categories: Groceries, Kids, Home, Fun, and Personal. Each transaction got a “Person” column as well. Their dashboard showed joint expenses on the main chart and individual “fun money” on small side charts. After three months, the data revealed that both of them were underestimating “small treats” like coffees and spontaneous online buys. The arguments cooled down: the dashboard made the problem visible without blame, and they agreed to create separate personal budgets for guilt‑free spending.
Debt Payoff: Visualizing Progress to Stay Motivated
Another real‑world story: Daniel had three credit cards and a small personal loan. He felt stuck because minimum payments barely changed the balances. Instead of just listing debts, he added a “Debts” sheet linked to his main dash. Each month, he recorded balances and interest rates. The dashboard showed a stacked area chart of total debt over time and a simple forecast: “Debt‑free date if you keep current payments” vs “Debt‑free date if you add 100/month.” Watching the line bend downward turned abstract advice into something concrete. After six months of sticking to the new payment plan, Daniel’s total interest projection dropped significantly. The visual trend line mattered more than any motivational quote; he could see progress even when the balance on a single card didn’t move much.
Common Misconceptions About Excel Dashboards
“Dashboards Are Only for Advanced Users”
Many people assume dashboards require advanced formulas or coding. In practice, 80% of a good dashboard is clear thinking, not fancy functions. SUMIFS, a few charts, and basic pivot tables will take you very far. You can build a calm, informative overview in a weekend even if you haven’t used Excel since college. The mental shift is more important: stop trying to mirror your bank app and instead ask what decisions you want help with. Once those questions are defined, you’ll notice that the technical steps are repetitive and learnable. If you feel intimidated, start with one view only: current month income vs expenses. Expand later as your confidence — and your data — grows.
“Templates Will Magically Fix My Finances”
Another trap is treating templates like a cure‑all. You download something glossy, maybe the first result for excel budget template download, fill it for one week, and then drop it. The problem isn’t the file; it’s the expectation. A dashboard is not a fortune teller. It won’t stop overspending by itself, and it doesn’t need 20 charts to be effective. Its real job is boring: to reflect reality accurately and quickly. That means categories that fit your habits, regular updates, and a few simple visuals you actually look at. When you treat Excel as a mirror instead of a magic wand, the dashboard becomes a daily tool: open it in the morning, glance at your “available to spend,” and adjust plans before the money leaves your account.
—
If you approach Excel as a flexible toolkit rather than a rigid program, your personal finance dashboard becomes a living system. Start small, update regularly, and let your own questions shape the structure — the rest is just cells, formulas, and honest numbers.